Commodities Wrap: Copper surges to record high amid frenzied buying
Friday 30 Jan - Commodities

Summary
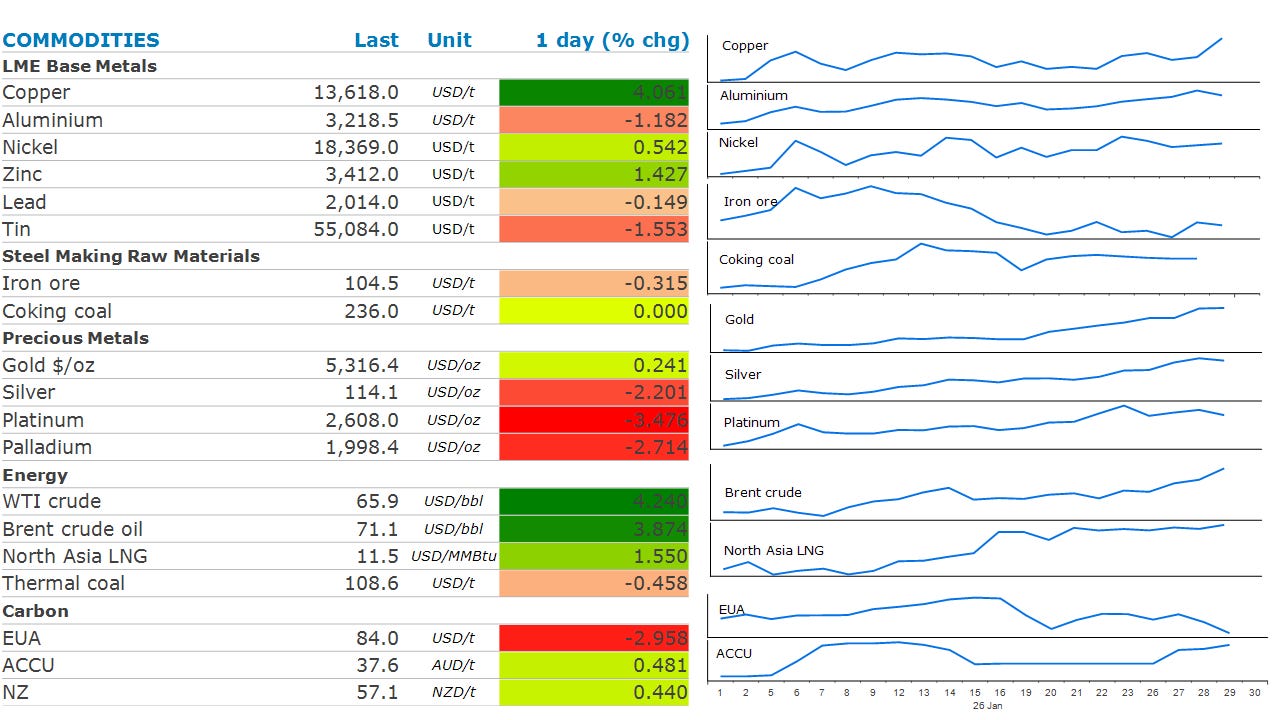
Copper surged amid strong demand for hard assets. Oil rallied as geopolitical tension rose. Gold fell as a weaker USD triggered selling.
Prices and commentary accurate as of 07:00 Sydney/05:00 Singapore/17:00(-1d) New York/22:00(-1d) London.
Ahead Today
Central bank speakers: St. Louis Fed President Alberto Musalem (keynote on US economy & policy; University of Arkansas).
Economic data: Eurozone GDP (4Q) (11:00 Brussels); Germany CPI; Germany GDP; Germany unemployment; France GDP; Italy GDP; Italy unemployment; Spain GDP; Spain CPI; Japan Tokyo CPI; Japan jobs; Japan industrial production; Japan retail sales; US PPI (08:30 NY / 13:30 UK / 00:30 AEDT Sat); MNI Chicago PMI; Eurozone unemployment; ECB inflation expectations; Czech GDP; Hungary GDP; Netherlands GDP; Mexico GDP; Hong Kong GDP; South Africa trade balance; South Korea industrial production; Taiwan GDP; Thailand trade.
Commodities reports: Shanghai Exchange weekly commodities inventory (~15:30 local HKT → 02:30 NY / 07:30 UK / 18:30 AEDT); CFTC Commitments of Traders (15:30 NY / 20:30 UK / 07:30 AEDT Sat).
Events: UK Hydrocarbon Oils Bulletin (09:30 UK / 04:30 NY / 20:30 AEDT); India Energy Week (last day); Baker Hughes Annual Meeting (Florence; last day); Earnings: Imperial Oil (4Q); Chevron (4Q); Exxon Mobil (4Q); Brent March futures expire.Market data: Baker Hughes US rig count (13:00 NY / 18:00 UK / 05:00 AEDT Sat); ICE Futures Europe weekly COT (18:30 UK / 13:30 NY / 05:30 AEDT Sat).
Listen to today’s 5in5 with ANZ podcast for more on the global economy and markets.
Market Commentary
Copper surged amid a wave of Chinese buying. Prices gained as much as 11% to trade above USD14,500/t for the first time. The initial rally started in the Asian trading session, but the buying continued into the London session as investors looked to capitalise on the strong demand. Weakness in the USD appears to have triggered the latest rally, with investors keen to secure hard assets amid the uncertain geopolitical backdrop. The speculative rally has seen a surge in volumes on the Shanghai Futures Exchange. January was already the busiest month on record for copper before Thursday’s session racked up its second-biggest daily trading volumes ever. There are also supply and demand factors underpinning the rally. The outlook for demand has improved amid a less gloomy economic outlook. Fed Chair Powell talked up a “clear improvement” in the US economic outlook as the Fed kept interest rates steady this week. The ongoing energy transition and AI-fuelled infrastructure frenzy are boosting demand. Performance was mixed for the other base metals. Nickel and zinc finished higher, while aluminium closed lower.
Gold rallied to another record high before a sharp selloff late in the session. It traded above USD5,500/oz before a rebound in the USD late in the session triggered heavy selling. Gold fell by as much as 5.7% in the biggest intraday drop since October 2025. Silver also came under pressure, falling as much as 8.4%. Gold’s relative strength index spiked above 90, while silver’s was around 84. Readings above 70 typically signal the asset has been overbought and is due for a pullback. The recent rally has seen some physical buyers retreat to the sidelines. The World Gold Council reported that central bank demand cooled in Q4 2025. However, it was more than made up for by investors. The council also warned that India’s gold imports are expected to fall this year as record prices crimp demand for jewellery in the world’s second-largest market.
Crude oil rallied amid renewed geopolitical tensions in the Middle East. Brent crude traded above USD70/bbl for the first time since August 2025 as President Trump ramped up pressure on Iran. He warned Iran to make a nuclear deal or face military strikes. Associated Press reported that Iran issued a warning to ships at sea that it planned to run a drill next week that would include live firings in the Strait of Hormuz. That stocked fears of a potential closure of a waterway that caries approximately 20% of world oil supply. Iran accounts for about 3% of global supply. It’s clear that the market is now pricing in a geopolitical risk premium amid the risks to supply disruptions. This will be a factor for OPEC+ to consider when it gathers online this weekend to discuss supply strategy. Expectations are high that the group will ratify the last part of this quarter’s oil production pause. According to local media reports, three delegates reiterated this week that the alliance will confirm this strategy. A more uncertain decision awaits OPEC at its monthly meeting in early March, when it will consider what to do after the first quarter pause expires.
North Asia LNG prices ended the session up, on the rally in crude oil markets. However, forecasts indicating colder temperatures have also been bolstering sentiment. Japan expects below normal temperatures into early next week. Persistently cold weather across Asia may drive up competition for LNG with Europe.
Chart of the Day
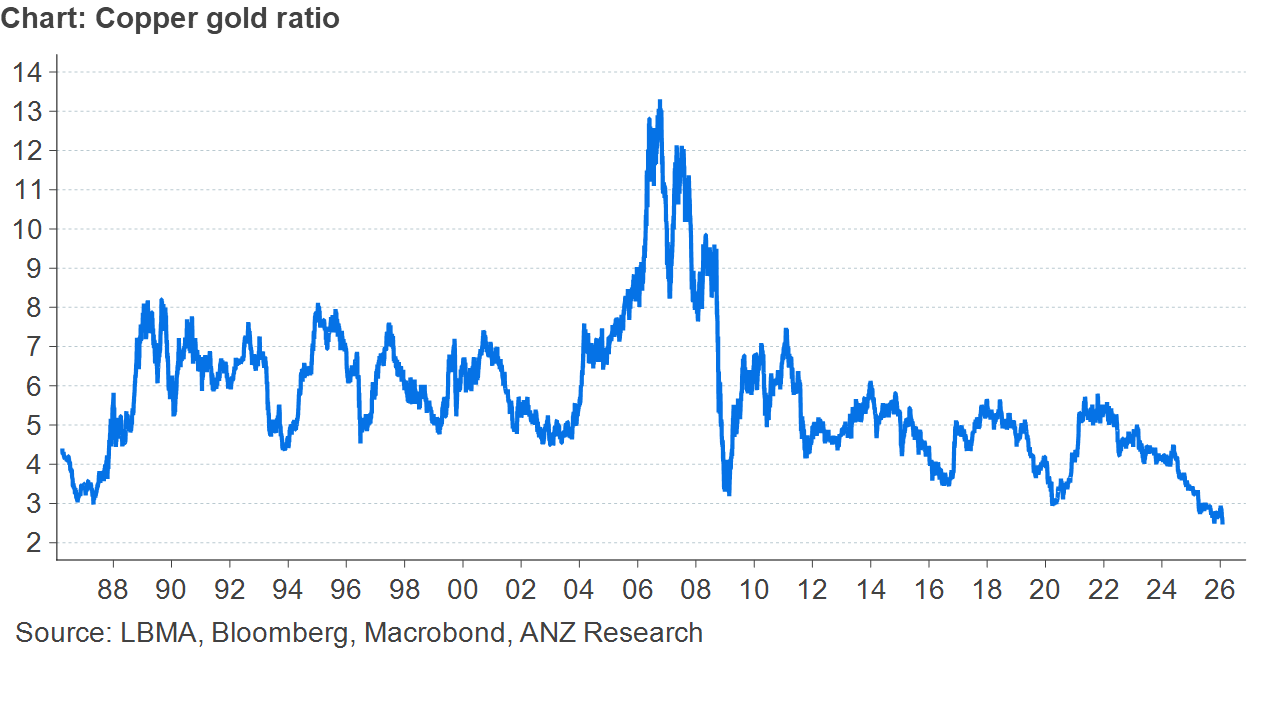
The copper/gold ratio has long been used as a key economic indicator comparing industrial demand (copper) to safe-haven sentiment (gold). A rising ratio signals economic expansion and "risk-on" sentiment, while a falling ratio indicates economic slowdown, recession fears, or "risk-off" market behavior.
Despite the rally in copper prices recently, gold has performed even better. This has seen the ratio continue to fall. This time last year it was sitting at 3.4. It is currently sitting at 2.52.
However, we don’t believe it suggests the economic outlook remains fragile. The copper price is currently reflects longer term demand amid the massive investment in an AI-powered, electrified, renewables-heavy economy that should require more copper. The gold price reflects fractured geopolitical landscape and a reassessment of unquestioned US dominance across the global financial system.
These two narratives can occur simultaneously. What this means is that the ratio is no longer a clean, high frequency “risk on/risk off” signal. Instead, it now tells a more complex story about how capital is being allocated between our economic future and our geopolitical present.
5in5 with ANZ Podcast

Really sharp take on the copper rally. That observation about the copper/gold ratio losing its traditional signal value is spot on, like we're watcing two separate narratives unfold simultaneously. I've seen this in metals trading where old rules don't quite apply when geopolitics and tech infrastructure both pull demand.